I am writing this post primarily to understand Filatex India Limited’s business and unit economics. I have already written about the company’s business and its history, its valuation, quarterly results as well as its performance in FY22. This post will contain some of the aspects of the company that I had not mentioned in my previous posts as well as the unit economics.
PRICING POWER
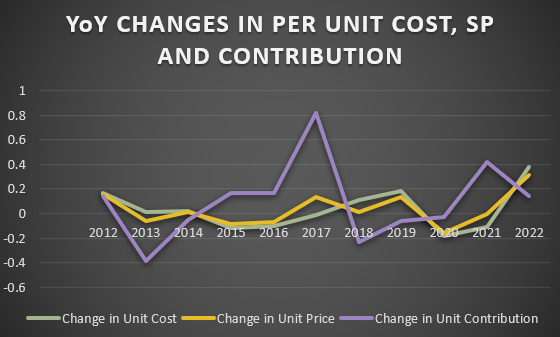
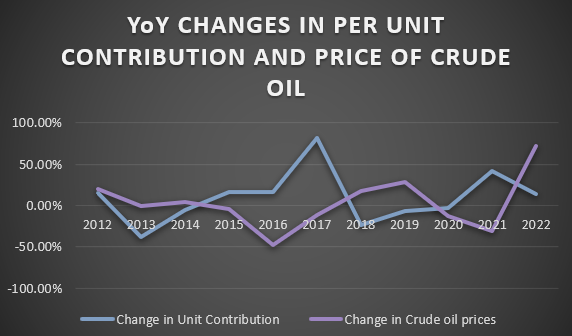
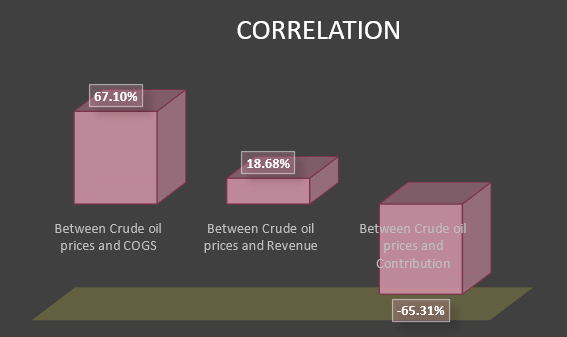
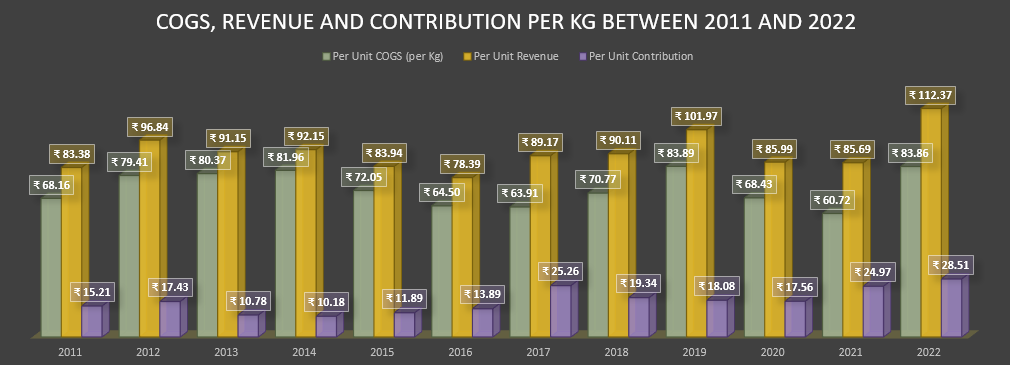
Between 2011 and 2022, there had not been a single FY when the per unit COGS increased YoY, in which the SP increased more than proportionately, conversely almost every decline in per unit COGS was followed by a more than proportionate increase in per unit contribution. This indicates the existence of a high degree of correlation between per unit cost and contribution to crude oil prices. This is further substantiated by figure 8 which shows that Filatex India’s per unit COGS was positively correlated to crude oil prices, between 2011 and 2022, to a degree of 67% and per unit contribution and crude oil prices, during the same period, was negatively correlated to a degree of 65%.
These observations indicate that the company’s margins are largely at the mercy of the crude oil prices, it will benefit substantially whenever the crude oil prices drop (ideally below $60/barrel) but will suffer whenever the prices rise due to its inability to pass on the inflation to its customers. This proves Filatex’s lack of pricing power (I wish I was a little less dumb when I bought this stock). This is probably caused by the bargaining power of suppliers of the company (large and few players).
DILUTION
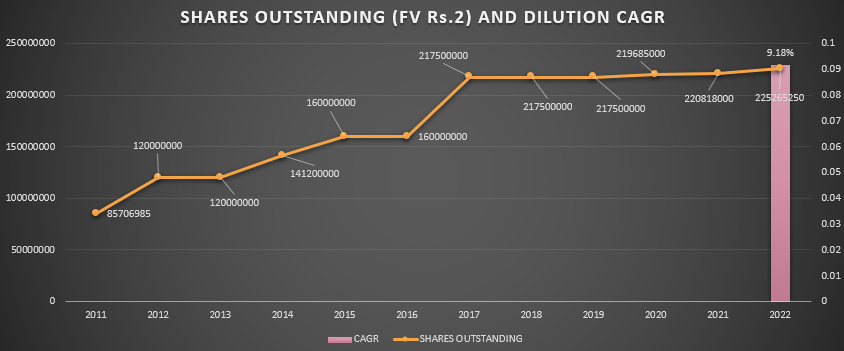
The company has consistently issued new shares over the last eleven years, as fresh issues as well as employee stock options. Between 2011 and 2022, the company’s outstanding shares, after adjusting for bonus issues and split, have increased at a CAGR of 9.18% which is a highly dilutive rate but the dilution has considerably slowed down in the last five years to a meagre 0.7% CAGR and moreover, the company did a buyback during FY23.
WORKING CAPITAL RATE
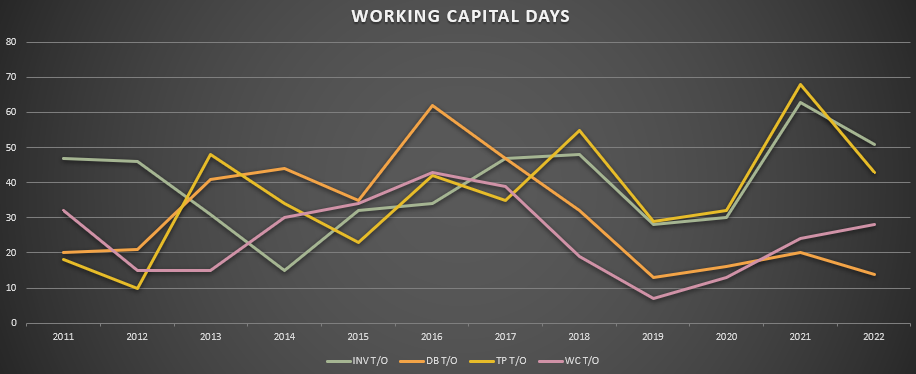
Filatex India’s working capital days have been erratic, it showed a rising trend between 2013 and 2016 but it shortened thereafter till 2019 and now again it is on a rising trend. This pattern is the exact opposite of the pattern of changes in crude oil prices (refer to figure 2). I thought WC would move in line with the crude oil prices as lower crude oil prices would mean lower cost, more demand and faster realisation. Maybe this pattern is caused by trade payables days, as higher crude oil prices force the suppliers to allow longer credit periods. 40 and 10 days are the higher and lower bandwidths.
MANAGERIAL REMUNERATION
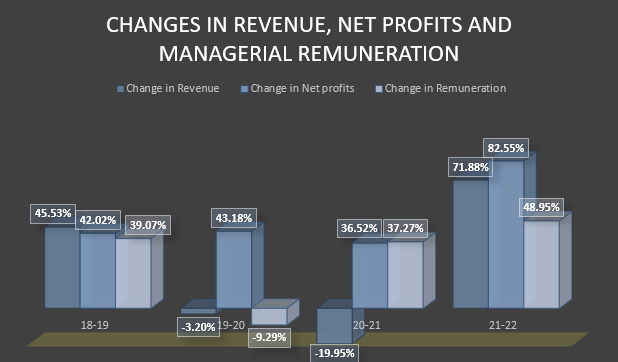
The total managerial remuneration (three WTDs and CFO) has not increased at a rate faster than the rate of change in net profits between 2018 and 2022.
REVENUES AND MARGINS
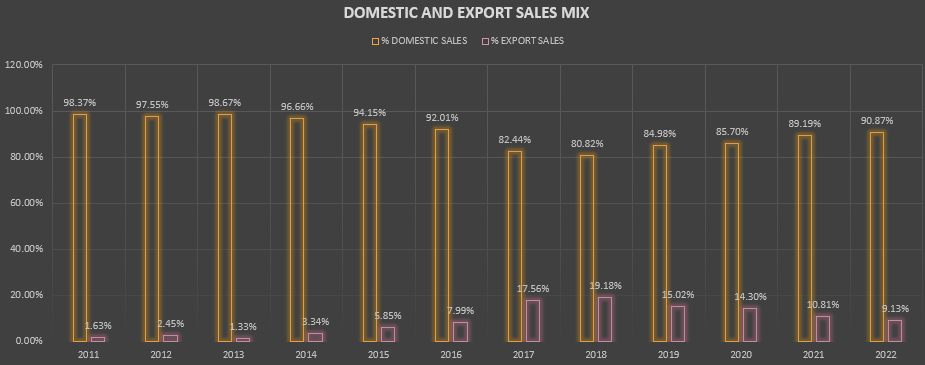
The company’s export revenues’ share in the total revenues from operations was on an increasing trend between 2011 and 2018 and then started diminishing ever since probably because of the erratic changes in crude oil prices (sharp spikes during FY19 and FY22) along with lockdowns during FY21 and FY22 and high shipping costs.
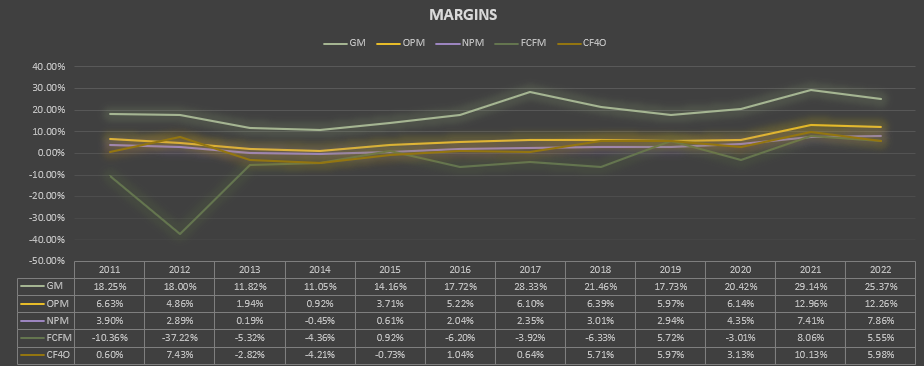
Filatex India’s gross margins are closely correlated to crude oil prices i.e., it moves in the opposite direction of crude oil prices (more on it in the pricing power section). OPM and NPM saw a spiked increase in FY21 and FY22 till then both had been consolidated in a narrow band as the company saw two of the highest contributions per unit in the last eleven-year period. Except in 2013 and 2014, the company managed to generate net cash flows from operations in all the financial years.
PROFITABILITY
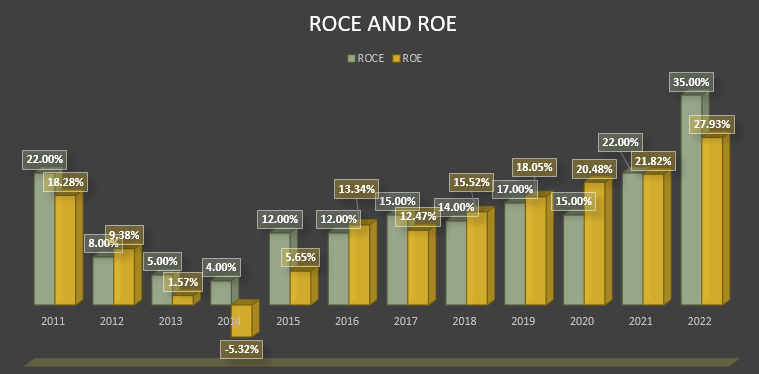
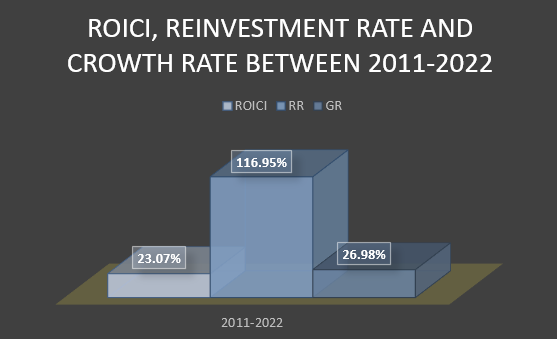
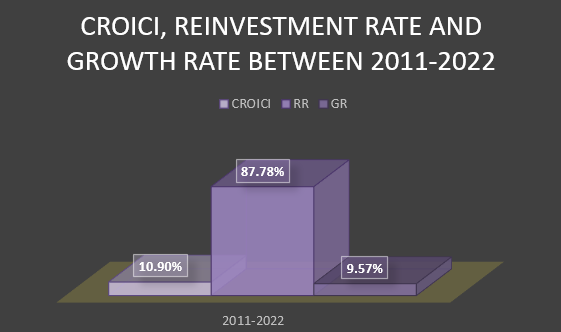
Since FY14, Filatex’s ROCE and ROE have been on a rising trend due to operational efficiency as a result of scale economies, declining finance costs and better margins. The company’s return on incremental capital invested (ROICI) during the 2011-22 period was a commendable 23% and with over 116% reinvestment rate (caused by share capital issues), the growth rate should have been 27%. In reality, the CAGR of net profits during the same period was 28.6% falling in the vicinity of the ROICI-led GR. The company’s cash return on incremental capital invested (CROICI) during the same period was a mediocre 10.9% and the cash reinvestment rate was 87.78% resulting in an implied growth rate in net cash from operations of 9.5%. But the real CAGR of the CFO was 30.9%. The difference between the GRs was probably caused by the fact that the formula of CROICI (as defined by me) doesn’t consider all the cash flows.
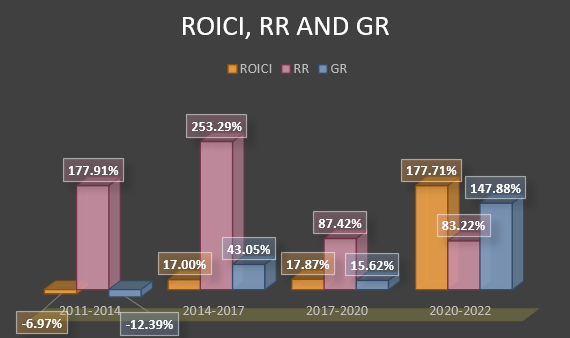
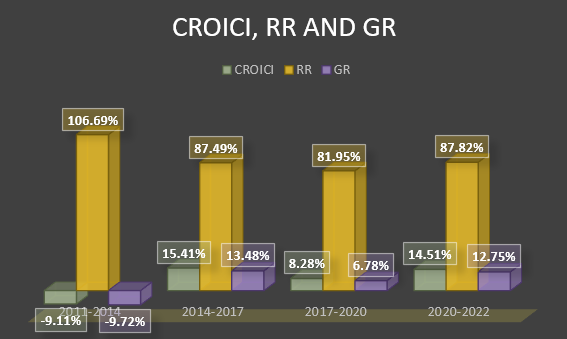
While the ROICI for three-year periods between 2011 and 2022 show a rising trend, CROICI shows a cyclical pattern.
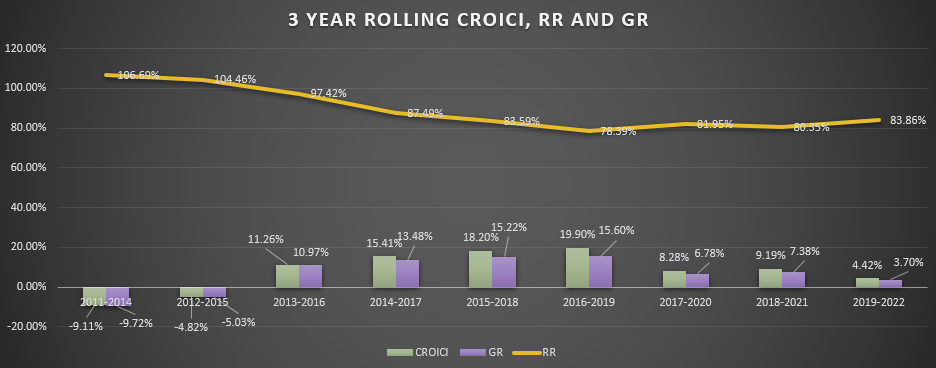
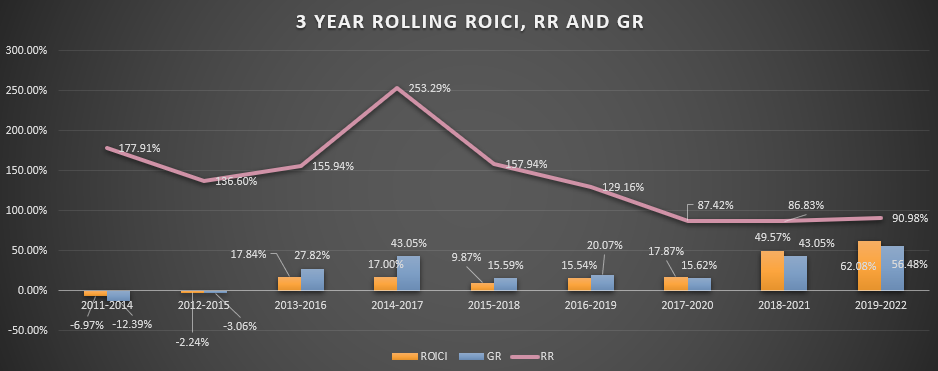
Similar to the above observation, the rolling ROICI shows a rising trend, albeit an erratic one whereas the rolling CROICI shows a cyclical pattern, possibly caused by the working capital changes.
All in all, Filatex’s business is profitable enough to generate at least double-digit ROE, ROCE, ROICI and CROICI but its ability to produce outstanding results depends upon the crude oil prices, the company’s ability to pass on the inflation and volume growth.
If you liked what you read, please share this post with your friends and enemies.
Check out this post by Financial Odyssey
Tweet
* In this write-up, I have used the term Contribution erroneously. Please substitute it with Gross Profits. Contribution refers to profits left over after deducting all the variable costs.
DISCLAIMER
Do not interpret anything above as financial advice. The author is not a SEBI registered financial advisor. This article is prepared by the author for informational & educational purposes only. The writing contains certain forward-looking statements and opinions which are based on the Author’s analysis of publicly available information believed to be accurate and reliable. While the author believes that such forward-looking statements and opinions are reasonable, they are subject to unknown risks, uncertainties, and other factors that could cause actual results to differ materially from those projected. As of the date the Report is published, the author may or may not hold a position in the security mentioned. Nothing in this Report constitutes investment advice. Readers should conduct their due diligence and research and make their own investment decisions. Any financial decision made by the reader based on the information herein will be the reader’s sole responsibility.